Power Skills, FTP & Fitness Telemetry Analytics

Unlock advanced power curves, automated FTP tracking, VO₂max trends, and impulse-response fitness model modeling.

Spider Chart Analysis

Power Skills Profile

Track your maximal power output across 7 duration benchmarks: 5s, 30s, 1m, 5m, 10m, 20m, and 1 hour. Identify whether you are a Sprinter, Puncheur, Time-Trialist, or Climber.
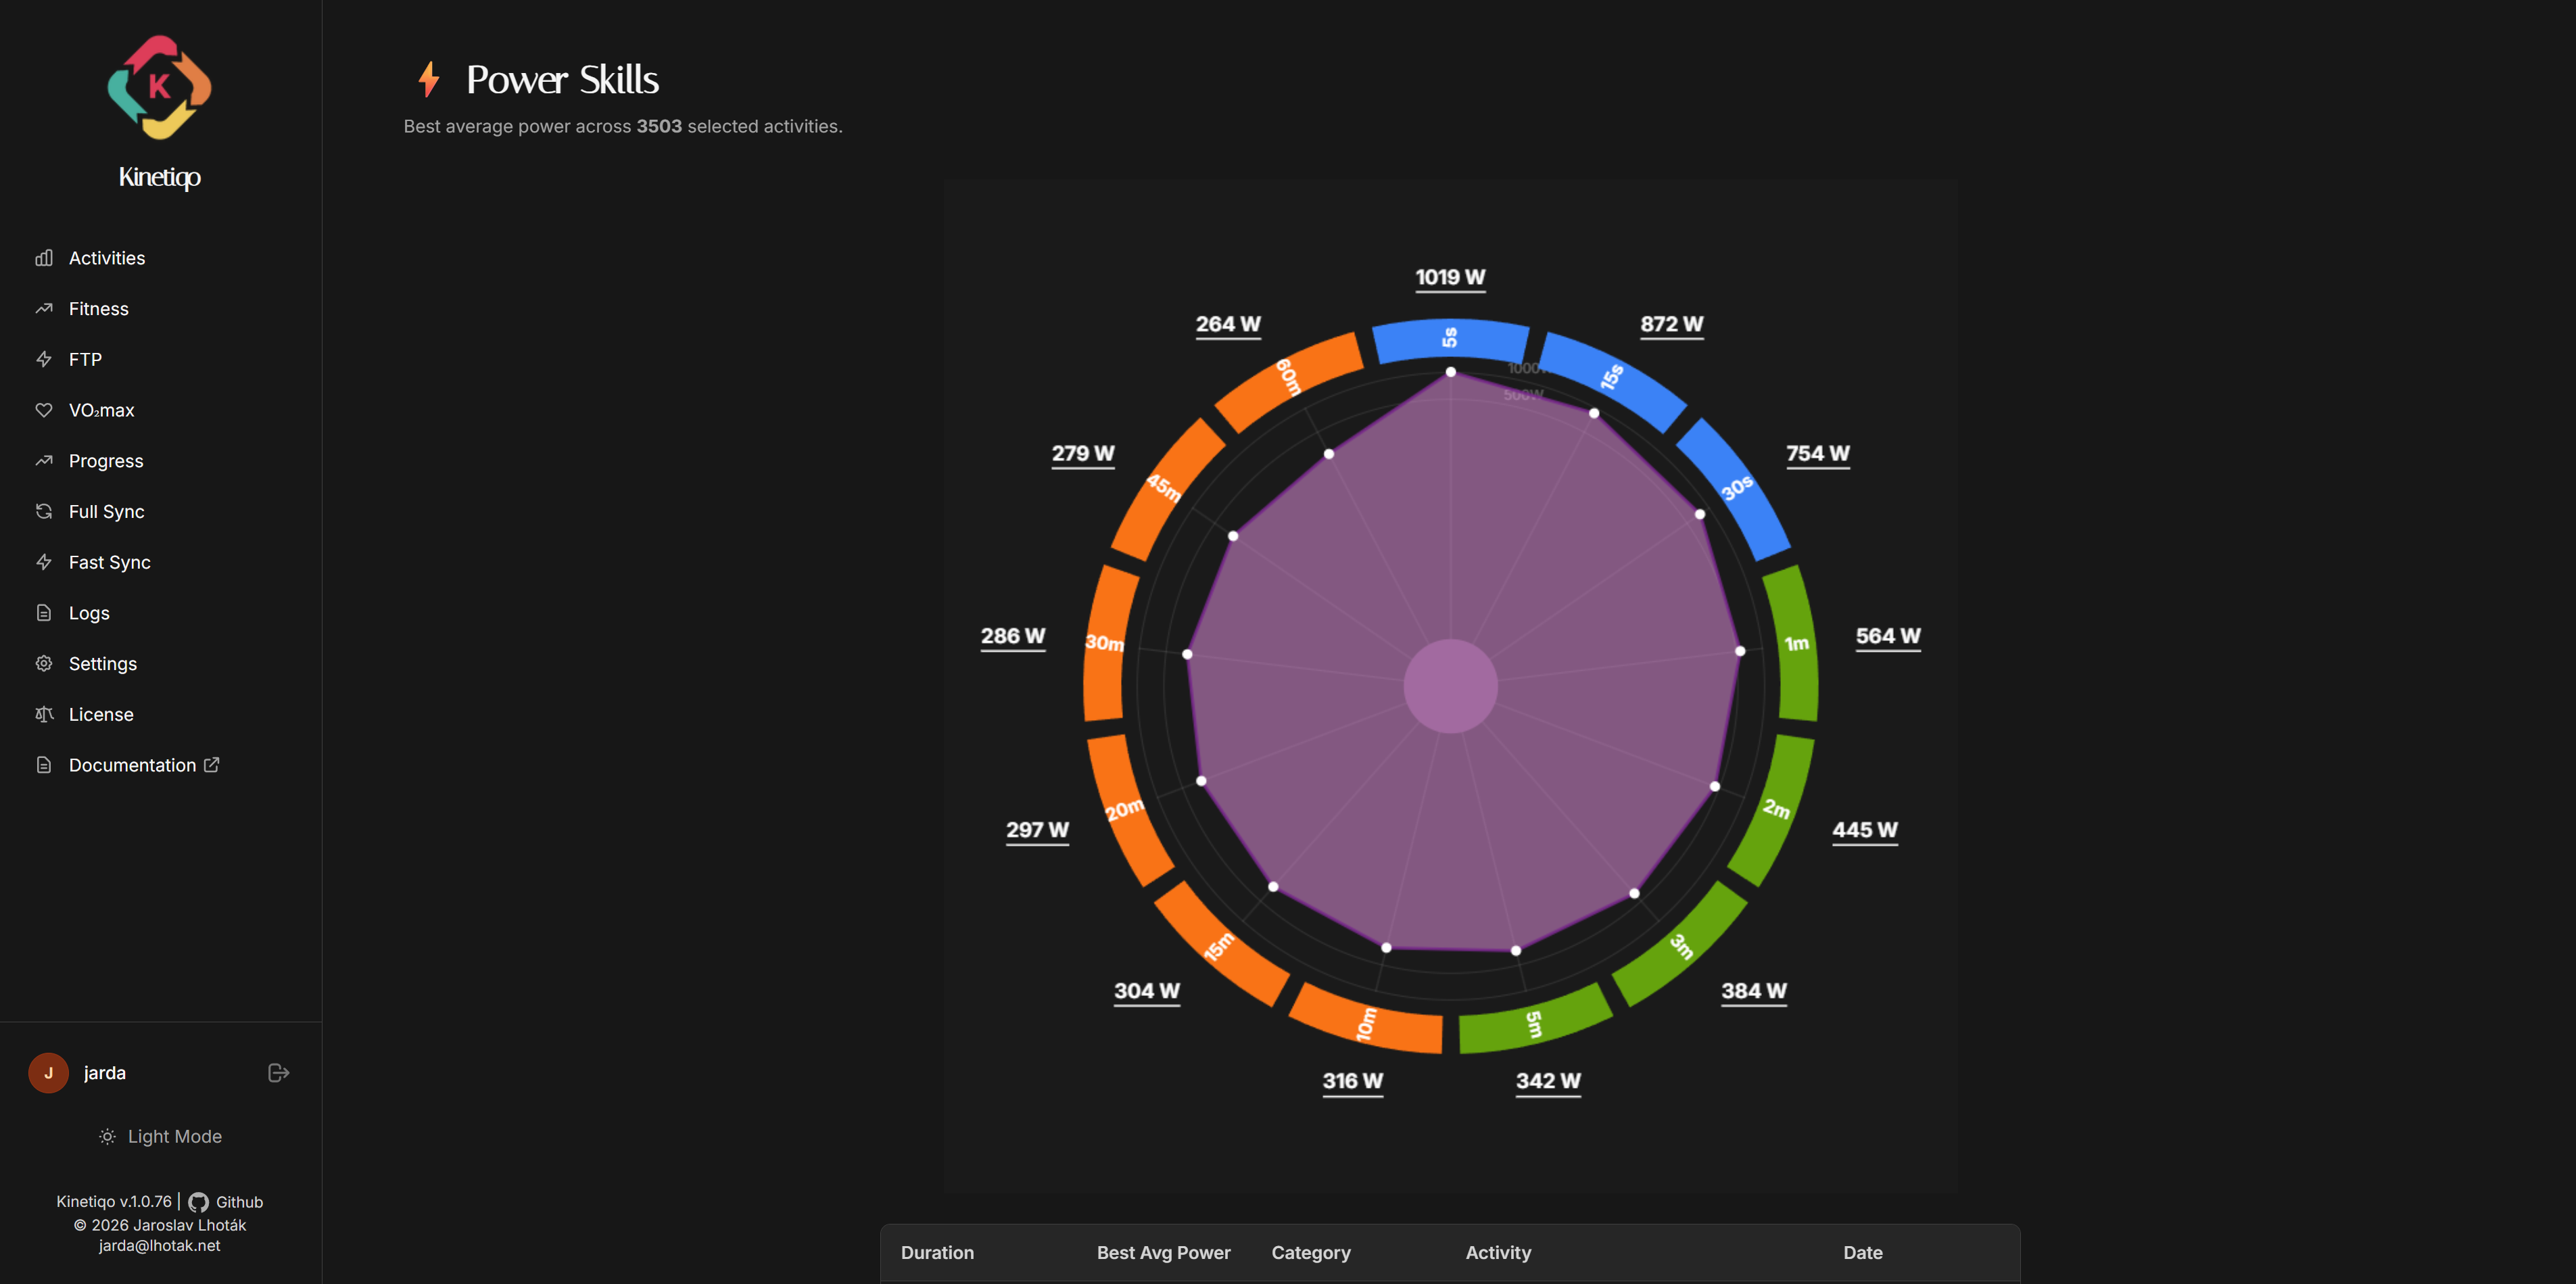
  • Filter by individual activity or aggregated lifetime records
  • Interactive radar canvas rendered locally with Chart.js
  • Automatic unit conversion (Watts and Watts/kg)
Power Skills Spider Chart
Threshold Power

Automated FTP Estimation (95% 20-min)

Never miss an FTP increase. Kinetiqo scans every ride stream for peak 20-minute power outputs and logs estimated Functional Threshold Power trends over time.
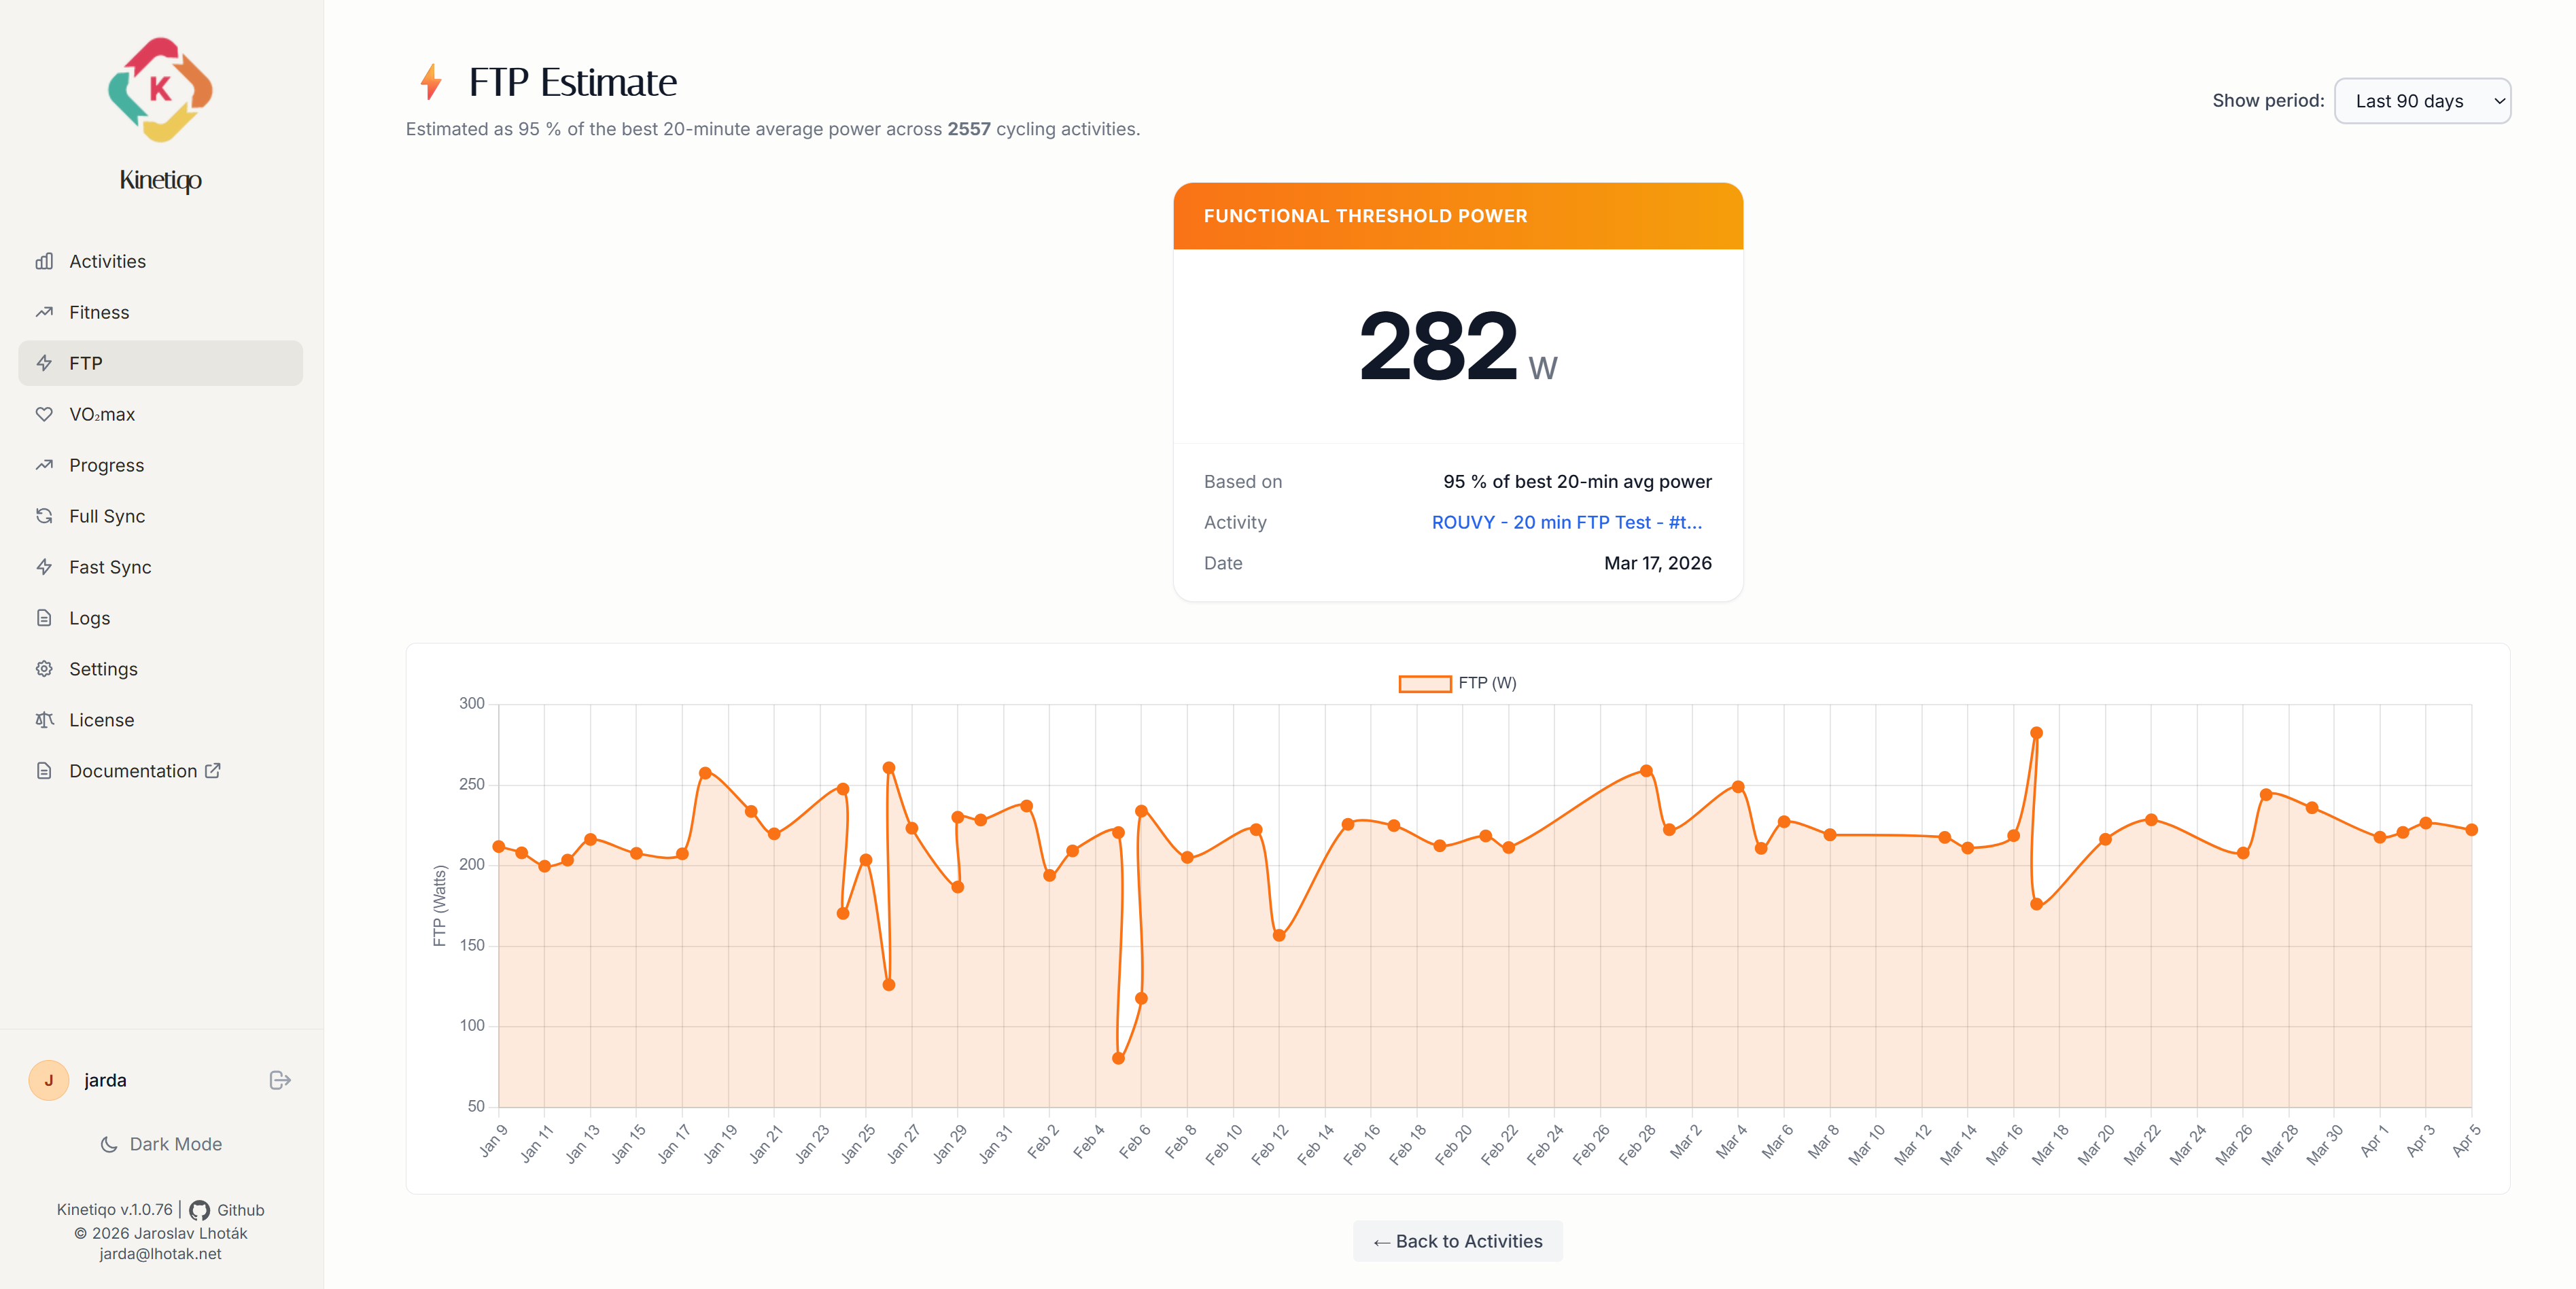
  • Server-side validation enforcing 0 < FTP ≤ 1000 W
  • Per-ride breakdown table with direct jump to Strava
  • Automatic integration into suffer score load calculation
FTP History Chart
Physiological Modelling

VO₂max & Fitness / Freshness (CTL/ATL/TSB)

Monitor Chronic Training Load (Fitness), Acute Training Load (Fatigue), and Training Stress Balance (Form) using Banister exponential decay modeling calculated via pandas.
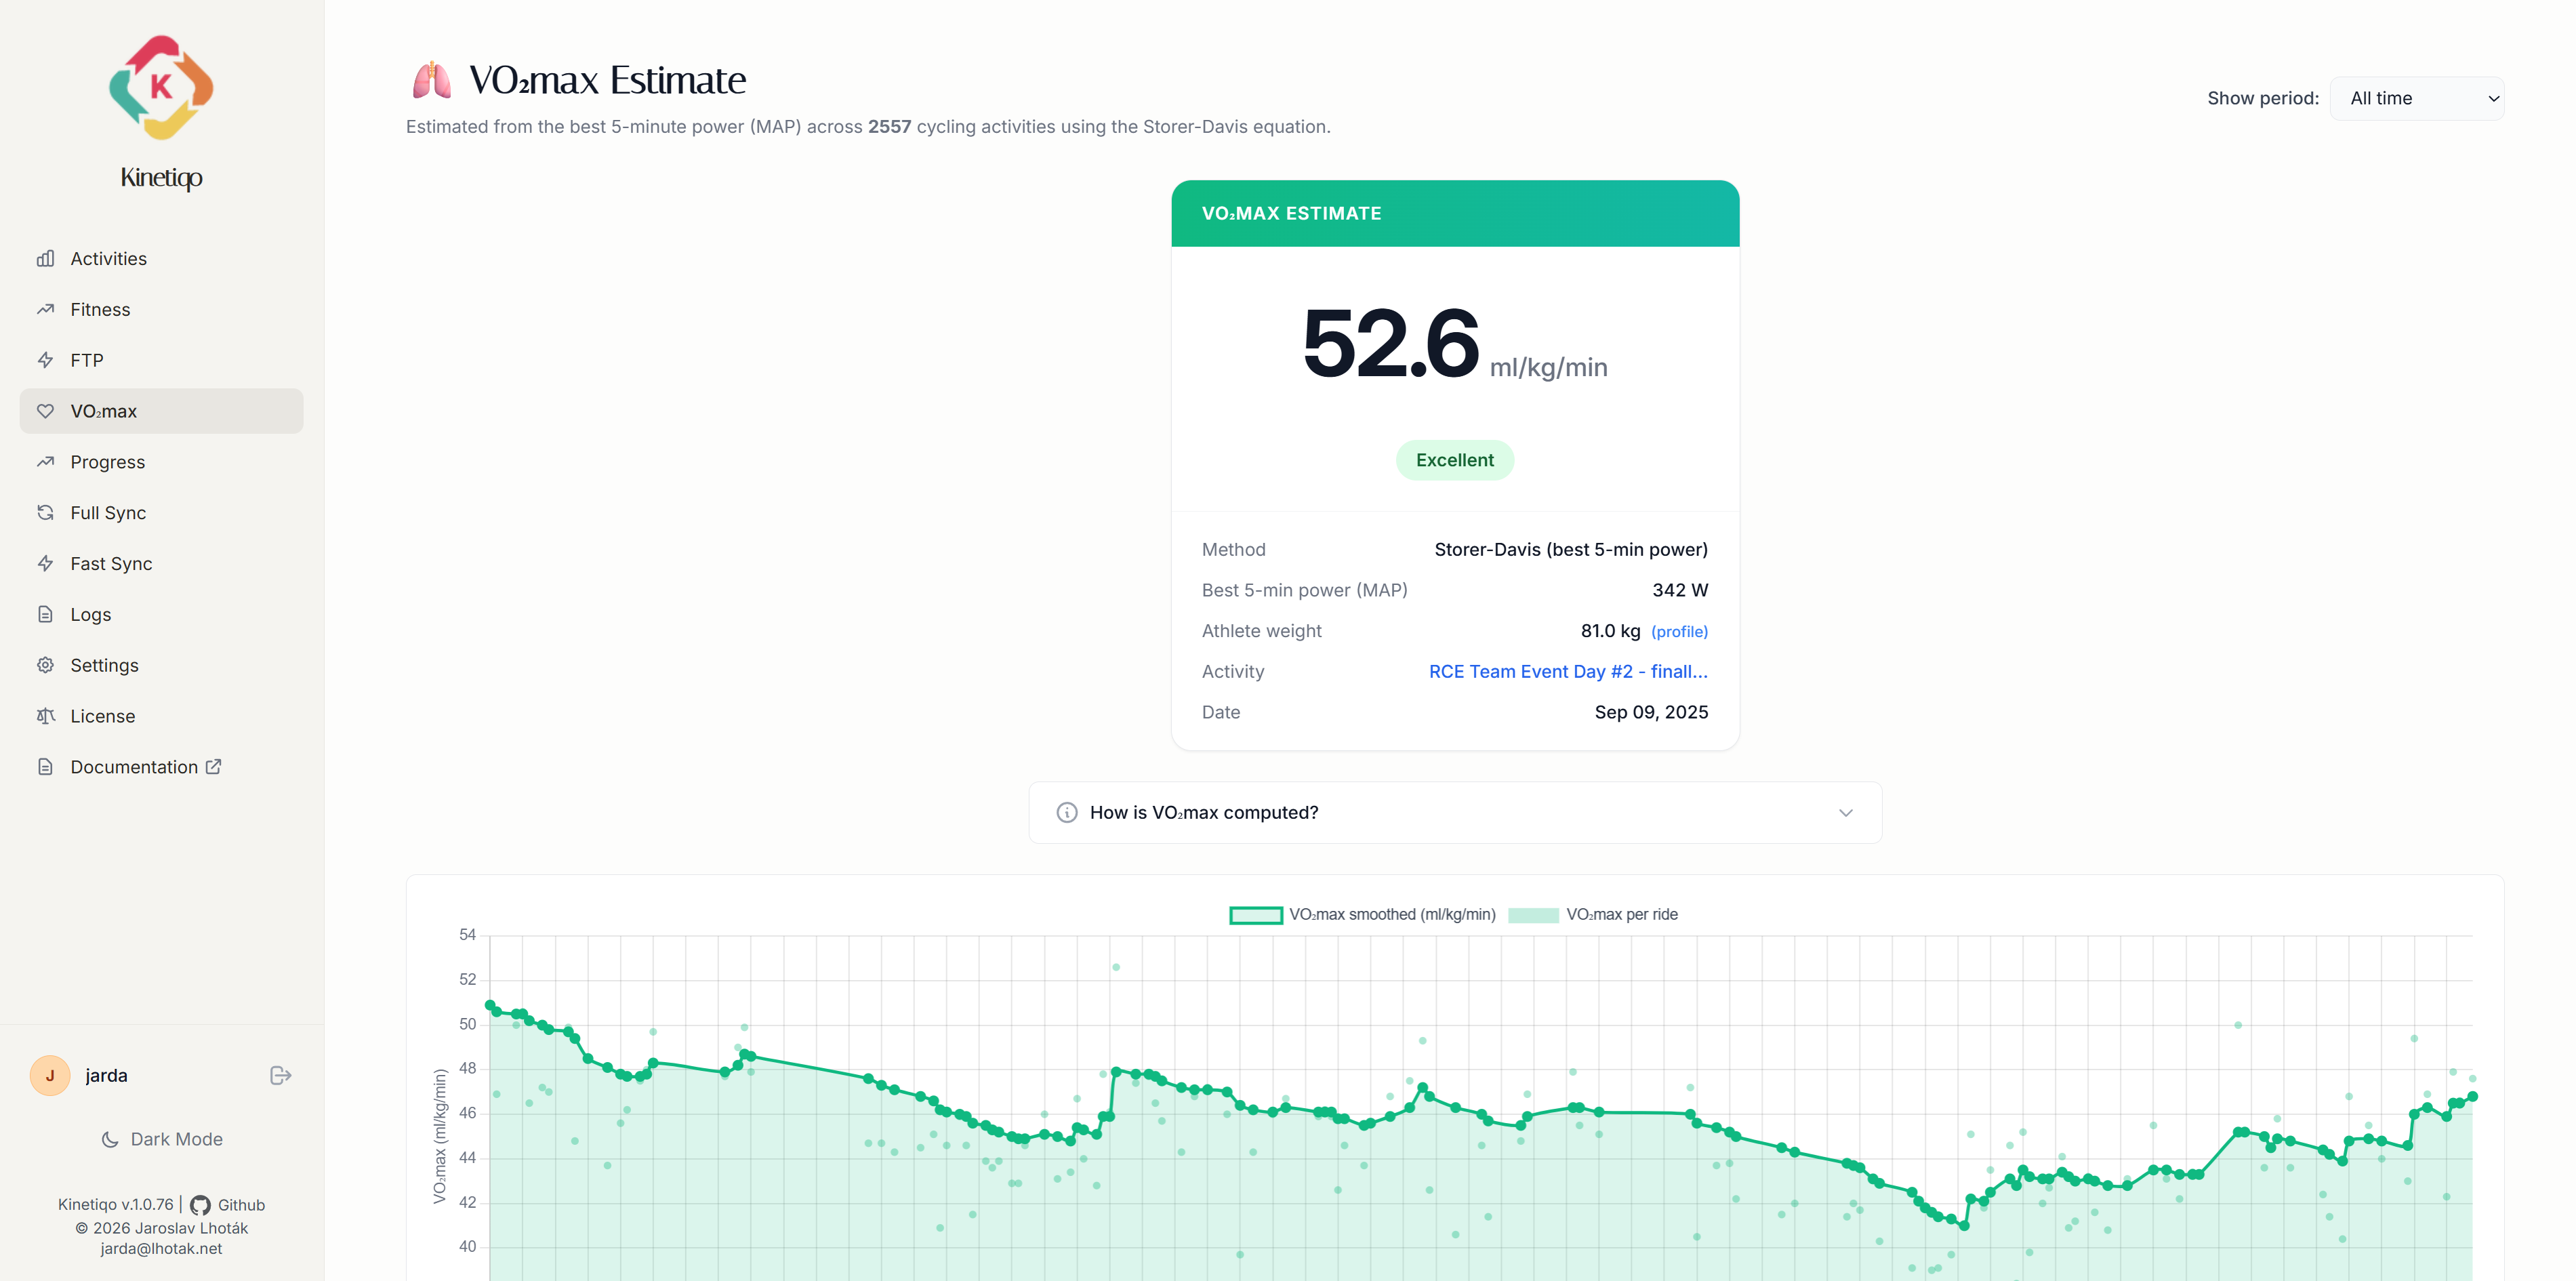
  • Townsend 5-min MAP power VO₂max estimation with fitness bands
  • Configurable time constants (e.g. 42-day CTL, 7-day ATL)
  • Interactive date range filtering and zooming
VO2max Trend Chart